- Approximately 5 minutes to read
- Learning objectives:
- Understanding population mean
- Implementing population mean at activation
- Optimizing patient experience and performance
Think of the last time you had a patient come in for their activation, and as soon as they sat down, their loved one immediately pulled out their phone to record, not wanting to miss those first few moments of hearing with their cochlear implant. Understandably so! It is an exciting moment in the patient’s journey towards better hearing.
However, that excitement has traditionally been met with the clinician letting the loved one know that a few measurements need to be taken first. “This will take several minutes, and then we will Go Live,” I used to tell my patients and their families. They would stop recording, put their phone back in their pocket, and settle into their chair with a little less wind in their sails.
Cochlear’s population mean reimagines this traditional activation workflow to meet the patient’s expectation for their activation.
What is population mean?
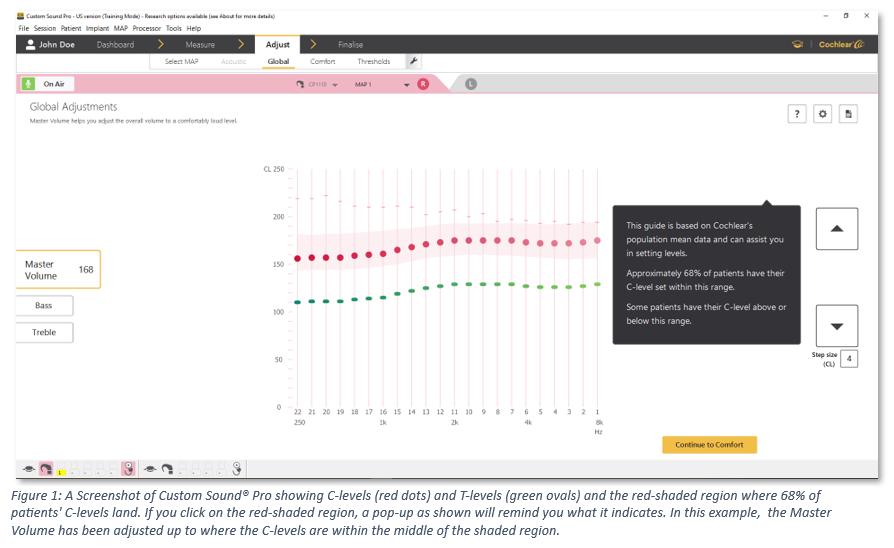
Population mean is one of several MAP creation methods available in Custom Sound® Pro fitting software. As its name suggests, it is an average MAP that was derived from an analysis of around 15,000 de-identified MAPs. It is electrode specific, so no matter what electrode your patient has, population mean has you covered.1 It features a large range of 46 clinical units between Threshold (T) and Comfort (C) levels, a feature that is associated with better performance in both quiet and in noise.2 In the population mean workflow, Custom Sound Pro displays a shaded target region that guides the clinician to where C-levels land for 68% of patients.

How do I use it?
First, navigate to “Adjust > Select MAP > Create > Population mean” to create a population mean MAP. Then Go Live by selecting “Continue on air.”
Population mean starts at low stimulation levels that are likely inaudible to your patient. While talking to the patient, gradually increase the Master Volume – both the T- and C-levels together – of the population mean MAP. Continue talking with them while they listen and experience their first moments hearing with their cochlear implant. Hopefully their family member was quick with the record button!
Set the overall volume of the MAP to “Loud” since we know the patient will quickly adjust to their new hearing.
How do I personalize the population mean MAP for my patient?
During activation:
After your patient has had a few minutes to listen with their cochlear implant, the next step is to personalize their C-level profile. Sweep across the array at C-level using bands and adjust as needed to ensure all bands are “Loud” to the patient. This accounts for any differences in the individual patient’s C-level profile.
At activation, we recommend an informal assessment of audibility using Ling sounds, for example. If results of the audibility assessment warrant, T-levels can be measured, especially if the patient is a good reporter and able to handle that level of listening task.
During the optimization phase (within 90 days of activation):
For most patients, T-levels are measured at their first optimization follow up visit. Measuring T-levels facilitates ideal audibility in the sound room, which is known to facilitate optimal patient performance.2 Since T-levels are generally stable after the optimization phase and have a range in which they can be set to provide good outcomes, we recommend T-levels be reassessed only as indicated by audibility or the patient’s sound quality concerns.3,4
Consider also utilizing objective measures to cross check the MAP. Neural Response Telemetry thresholds (tNRT) are known to be between T and C-levels of a MAP of the same pulse width.5 Electrically-Evoked Stapedial Reflex Thresholds (eSRT) are known to be approximately 15 clinical units above C-levels.6,7 Both tNRT and eSRT can give the clinician confidence that the patient’s MAP is set appropriately.
How does population mean benefit my patient?
Population mean creates an easier activation experience for patients and enables a quicker Go Live. It allows the patient’s first experience hearing through their cochlear implant to be meaningful, live speech. Contrast that first hearing experience with traditional workflows where the patient first listened for distant beeps of various pitches to measure T-levels.
Population mean focuses on performance. Research studies have shown that C-levels impact a patient’s performance more than T-levels.8 With this in mind, the population mean workflow prioritizes optimizing C-levels then refining T-levels. We continue to recognize the importance of well-set T-levels and the excellent audibility they provide – they are now measured in an appropriately prioritized programming sequence.
Wrap-up
Population mean was derived from an analysis of around 15,000 de-identified MAPs exported from clinic databases.1 Cochlear’s population mean workflow enables a patient-centered activation experience with a quicker Go Live. It has built-in MAP features that start the patient down the right track and is ready to be personalized based on a combination of your patient’s hearing experience and objective measures.
Bring the excitement of hearing into the activation earlier. Try population mean at your next activation appointment. Check out our “Adult Cochlear Connected Care model quick guide” for more information.
1 – Maruthurkkara, S., & Bennett, C. (2024). Development of Custom Sound® Pro software utilising big data and its clinical evaluation. International journal of audiology, 63(2), 87–98. https://doi.org/10.1080/14992027.2022.2155880
2 – de Graaff, F., Lissenberg-Witte, B. I., Kaandorp, M. W., Merkus, P., Goverts, S. T., Kramer, S. E., & Smits, C. (2020). Relationship Between Speech Recognition in Quiet and Noise and Fitting Parameters, Impedances and ECAP Thresholds in Adult Cochlear Implant Users. Ear and hearing, 41(4), 935–947. https://doi.org/10.1097/AUD.0000000000000814
3 – Dornhoffer, J. R., Khandalavala, K. R., Zwolan, T. A., & Carlson, M. L. (2023). Preliminary Evidence to Support a De-Escalated Cochlear Implant Programming Paradigm for New Adult Recipients: A Systematic Review. Journal of clinical medicine, 12(18), 5774. https://doi.org/10.3390/jcm12185774
4 – Busby, P. A., & Arora, K. (2016). Effects of Threshold Adjustment on Speech Perception in Nucleus Cochlear Implant Recipients. Ear and hearing, 37(3), 303–311. https://doi.org/10.1097/AUD.0000000000000248
5 – Di Nardo W, Ippolito S, Quaranta N, Cadoni G, Galli J. Correlation between NRT measurement and behavioural levels in patients with the Nucleus 24 cochlear implant. Acta Otorhinolaryngol Ital. 2003 Oct;23(5):352-5. PMID: 15108484.
6 – Holder JT, Henry MR, MacDonald AE, Gifford RH. Cochlear Implant Upper Stimulation Levels: eSRT vs. Loudness Scaling. Otol Neurotol. 2023 Oct 1;44(9):e667-e672. doi: 10.1097/MAO.0000000000003988. Epub 2023 Aug 23. PMID: 37621113; PMCID: PMC10637929.
7 – Holder, J.T. 2022. The Role of eSRT in Device Programming. Maximizing Performance in Cochlear Implant Recipients: Programming Concepts. New York, NY, United States.
8 – Martins, K. V. C., & Goffi-Gomez, M. V. S. (2021). The influence of stimulation levels on auditory thresholds and speech recognition in adult cochlear implant users. Cochlear implants international, 22(1), 42–48. https://doi.org/10.1080/14670100.2020.1822495


